Kundenfrequenz icon

Measure customer frequency

retail analytics dashboard

Customer segmentation

Analyze customer behavior

Enhance customer service

illustration of use-cases for the netavis retail analytics solution

1. Branch Management

Length of stay, customer frequency and customer segmentation comparing branches, departments and sales areas without losing focus on the important issues

2. Turn-In Rate for Vehicles

Count passing cars and detect the driving direction

3. Geographical customer segmentation with License Plate Recognition

Customer segmentation by country and district

4. Platform for Business and Security

Surveillance of the entire area with the proven CCTV system Netavis Observer

5. Customer Frequency

Accurate counting for zones and trip wires, detection of direction

6.

Demographic Customer Segmentation

Demographic Customer Segmentation
Face Detection provides statistical data about the age and gender of the customers. Detection of body height allows to distinguish between adults and children.

Digital Signage

Advertisements with digital signage systems can be controlled by the detection of dwell time, number of customers and demographic segments. The effectiveness of the content on digital signage systems can be measured by the attention time function.

7. Customer Frequency

Accurate counting for zones and trip wires, detection of direction

8. POS Data Integration

POS data can be integrated into the data platform to allow enhanced analytics functionality

9. Queue and Service zone management

Improve personnel planning and improve Customer service

10. Store Layout Analysis with Heat Maps

Display customer behavior in specific zones or entire shops

11. Mobility Data

Customer Segmentation with Mobile Phone Data

12. Staff Exclusion

Reliable customer data by excluding sales staff

1
2
3
4
5
6
7
8
9
10
11
12
Illustration zeigt Beispiele für die Netavis Retail Analytics Lösung
1

Branch Management

Length of stay, customer frequency and customer segmentation comparing branches, departments and sales areas without losing focus on the important issues

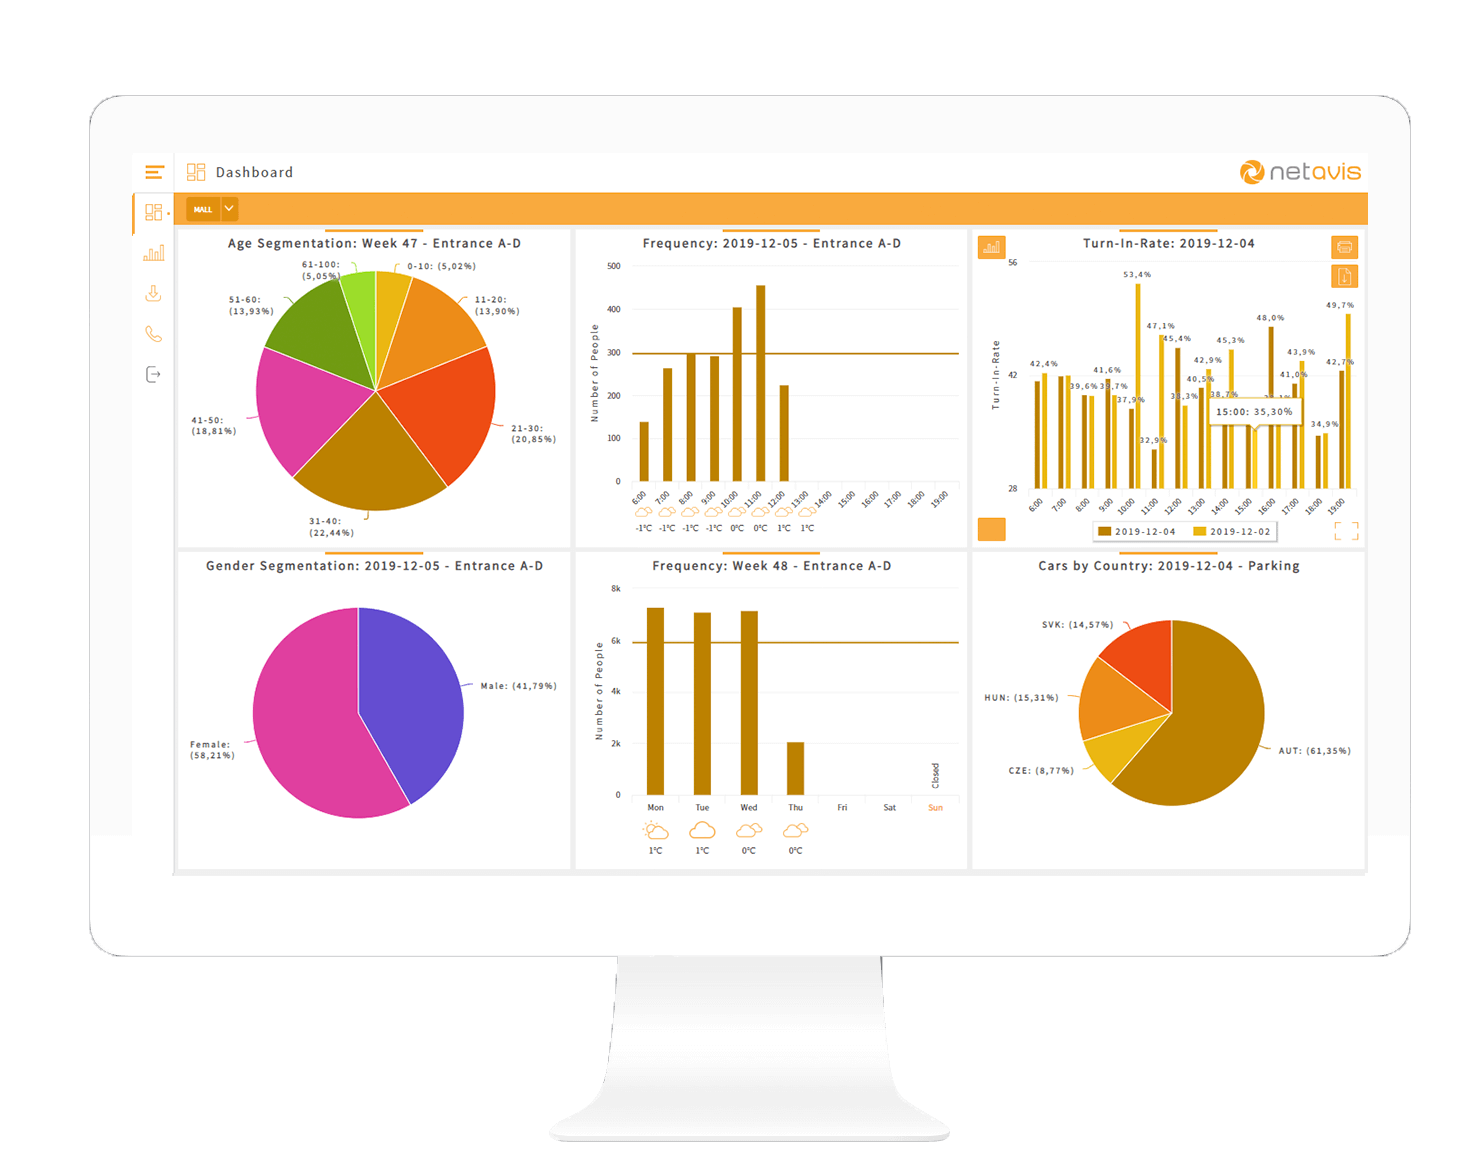
Easy navigation in the map view to display data for the entire network or specific details.

2

Turn-In Rate for Vehicles

Count passing cars and detect the driving direction

In accordance with the frequency of vehicles, a turn-in rate can be calculated to improve the effectiveness of marketing activities.

3

Geographical customer segmentation with License Plate Recognition

Customer segmentation by country and district

Information can be used for target group within the store as well as to provide statistics about the customer groups.

4

Platform for Business and Security

Surveillance of the entire area with the proven CCTV system Netavis Observer

Existing CCTV hardware can be re-used for business intelligence.

5

Customer Frequency

Accurate counting for zones and trip wires, detection of direction

The counting statistics allows to detect the number of persons to enter or exit the store and to calculate turn-in rates at any entrance or exit.

6

Demographic Customer Segmentation

Face Detection provides statistical data about the age and gender of the customers. Detection of body height allows to distinguish between adults and children.

Digital Signage:

Advertisements with digital signage systems can be controlled by the detection of dwell time, number of customers and demographic segments. The effectiveness of the content on digital signage systems can be measured by the attention time function.

7

Customer Frequency

Accurate counting for zones and trip wires, detection of direction

The counting statistics allows to detect the number of persons to enter or exit the store and to calculate turn-in rates at any entrance or exit.

8

POS Data Integration

POS data can be integrated into the data platform to allow enhanced analytics functionality

9

Queue and Service zone management

Improve personnel planning and improve Customer service

If defined queue lengths are exceeded, automatic opening requests for additional POS can be generated. If customers stay a long time in a pre-defined area, shop assistants can be informed automatically.

10

Store Layout Analysis with Heat Maps

Display customer behavior in specific zones or entire shops

Detect preferred and neglected areas, trends and typical movement patterns.

11

Mobility Data

Customer Segmentation with Mobile Phone Data

Data received from mobile providers contain information about gender, age and geographical data of the persons in the area.

12

Staff Exclusion

Reliable customer data by excluding sales staff

Detection of the staff is anonymous and accordance to privacy laws.

The Netavis Multi-Sensor Platform

sMart collects data from different sensors and systems for different applications

1
2
3
4
5
6
7
8
9
10
11
Infographic of the Netavis Multi-Sensor Platform with sMart collecting data from various sensors and owned and third party systems
1

e.g. counting data from existing sensors

2

Data collector for edge analytics devices

3

Video analytics data generated directly at the edge

4

Server-based video analytics data

5

Business data collected from POS Systems

6

Highly accurate counting statistics

7

For a reliable detection of objects without being subject to any privacy-related restrictions

8

For reliable detection of objects without being subject to any privacy-related restrictions and the option to exclude staff

9

For reliable detection of objects without being subject to any privacy-related restrictions

10

Future technologies

11

Prepare and export collected data for big data applications

Infographic of the Netavis Multi-Sensor Platform with sMart collecting data from various sensors and owned and third party systems

Upload existing data (CSV):

e.g. counting data from existing sensors

Edge Collector:

Data collector for edge analytics devices

Cameras with Edge Analyse:

Video analytics data generated directly at the edge

Observer & iCat:

Server-based video analytics data

POS Data:

Business data collected from POS Systems

3D Sensors:

Highly accurate counting statistics

Laser Sensors:

For a reliable detection of objects without being subject to any privacy-related restrictions

Time of Flight Sensors:

For reliable detection of objects without being subject to any privacy-related restrictions and the option to exclude staff

Radar Sensors:

For reliable detection of objects without being subject to any privacy-related restrictions

Future technologies

Output for Big Data Applications (XLS, CSV):

Prepare and export collected data for Big Data Applications

Netavis Datenschutz

Privacy

By separating video streams and business data, video analysis without personalization and selecting suitable sensors, our solutions are not subject to any privacy-related restrictions.

One solution for all retail sub-verticals

retail analytics für Einzelhandelsketten

Large retail chains with headquarters management

For centralized store coordination

Retail analytics für große Shoppingcenter

Multi-store shopping center

in the same location

For simultaneous control and seperate access to data

Retail Analytics für kleine shops

Small shops

with a single location

For small systems with full functionality

Project Schedule

  • 1

    Concept development

    Define the project scope and evaluate the initial state, existing hardware and software by our project managers

  • 2

    Software installation

    If necessary, the procurement of additional hardware by Netavis Partner

  • 3

    System configuration

    Including introduction and commissioning of the infrastructure

  • 4

    Technical Support

    After Sales Service Agreements and Software Update Licenses

sMart Demo

See what data you can get by using the Netavis solution

Click „Start Demo“

Input Username and Password

Log In

Get started today!

Stay in touch!

Join our mailing list.

*Netavis Software GmbH will use the information you provide on this form to be in touch with you and to provide you with marketing updates.